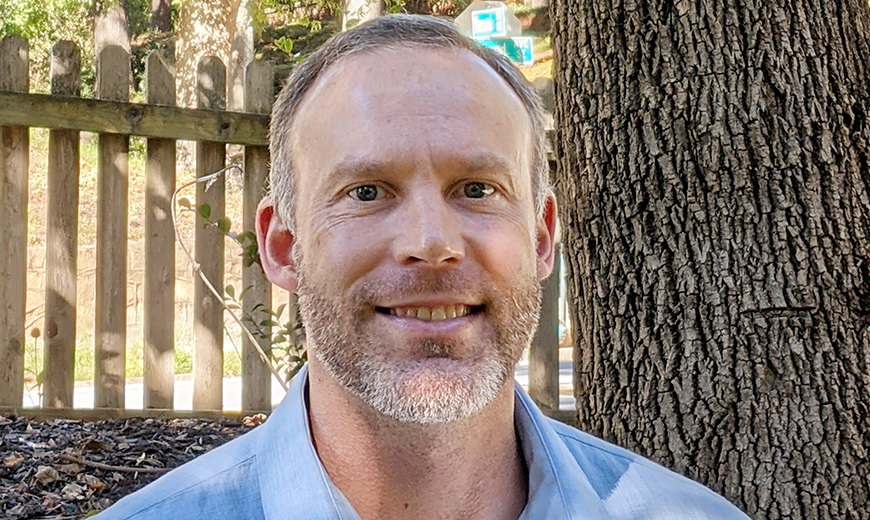
Matt Eblen ’00 recently answered a question most employers want to know — how long an employee will stay at a company.

Factoring in several characteristics — age, title, eligibility for retirement, education level — he built a model that predicts how long someone will work before resigning or retiring.
Eblen’s efforts gave his directors at the Centers for Disease Control and Prevention in Atlanta a clear idea of how many employees they can expect to retain, how many new ones should be hired and the jobs they need to reformulate. And he did it by applying survival analysis, an old statistics methodology, to the workforce.
Despite the raft of human resources data on employees, no one had yet analyzed it from a scientific perspective, he said.
“You can apply this methodology in other areas as well,” he said. “Whether you’re trying to predict the timing of a certain event — like when you retire or get a promotion or get reassigned to another unit — any event happening in time, you can put into this framework.”
Path to becoming a data scientist
As senior mathematical statistician for the CDC’s office of the chief operating officer, Eblen’s job doesn’t involve disease. He supports the agency’s “backbone,” collaborating with experts in HR, information technology, safety and budgeting on programs that affect each of its 25,000 employees.
Despite the quantitative nature of the job, it relies heavily on communication. As an independent specialist who doesn’t work with a team of data scientists, he has to explain complex processes to people who aren’t necessarily statisticians, he said.
“It’s a dynamic place to work,” he said. “You get exposed to all these different kinds of data from all these different systems, and you can use your skills to solve a problem or enlighten some kind of process to help the agency perform better.”
Eblen first experienced a collaborative environment at Willamette University. As a math major, he assumed there would be a lot of competition in the department, but he quickly discovered it was the opposite.
“It was understood that no one will get all of the questions right every single time, and people pitched in on whatever problem you were working on,” he said. “That spirit of camaraderie is so valuable in a discipline where there’s so many ways of looking at data, so many ways to get the interpretation wrong.”
Eblen balanced his math degree with the arts — discovering discipline through the Chamber Choir and broadening his understanding of South Africa, Australia and Germany through literature classes — before embarking on several years of travel. He wandered around Japan for a while, teaching English through the competitive JET Program, then returned to the U.S. in 2009 for his master’s degree in international affairs at the University of California San Diego, which refreshed his interest in math and set him on the path to becoming a data scientist, he said.
Accelerated leadership opportunities
Eblen’s first job, which he landed in 2009 through an accelerated government leadership program, paved the way for his career.
As a senior mathematical statistician at the National Institutes of Health in Maryland, he fielded questions from agency leadership and Congress about its $30 billion annual grant portfolio. He analyzed mountains of grant application data, gained an understanding of policy affecting grants and presented reports that required a thesis and supporting evidence, similar to that of an academic, he said.
“I loved the problem-solving aspect of it,” he said. “You would arrive at work in the morning and you’d have a question on your desk. It gave you an opportunity to not only be creative in how you approached problems, but also be rigorous and careful about how you collected and cleaned the data.”
In 2015, Eblen’s NIH supervisor accepted a job at the CDC, working for the deputy director for public health science and surveillance, and tapped him to join her. He shifted from focusing on one big grants database to a much broader role, mostly involving the workforce, tackling questions on the effects of potential staffing cuts or analyzing the productivity of CDC’s scientific workforce. In 2020, he was nominated to a covid taskforce for which he conducted analysis on mobility patterns and how they differ according to income, race and other factors.
His current job is a busy one, too. In less than a year, he served as the lead on a workforce analysis that required writing over 2,500 lines of code, analyzed return-to-work surveys critical to crafting the CDC’s future workplace policies and studied the agency’s workforce from the perspective of diversity and inclusion, among other efforts essential to the safety and security of employees.
It’s a lot of fun with considerable responsibility, he said, and represents the diversity of data science jobs today.
“Data scientists can work in more fields than you might expect,” he said. “It’s not just working for Netflix or Facebook — it’s working for all kinds of businesses and industries that need to be able to understand their data and use it to make intelligent decisions.”


